Import/Export and Reporting
Data from a table can be exported or imported depending on the permission access in the group setup. Imports can be done in an ad hoc manner allowing for the creation of new records, or applying updates to existing records. Exports can also be done in an ad hoc manner to obtain data in defined format from tables in the system. Additionally, reports can be created to automate exporting data on a scheduled or as-needed basis.
Export
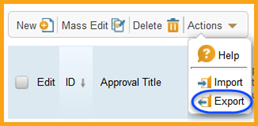
Within the required table, use the drop down next to Actions within the Action Bar to select the Export option.
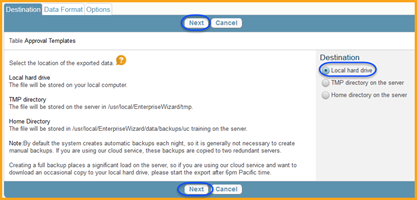
The Export Wizard will ask where the file will be sent to; in all cases choose Local Hard Drive to save the file onto the users personal computer or a network drive, then click Next.
The Export Wizard will then ask what format the information should be saved in. While Excel is the most commonly used choice, other formats are available. Select the necessary format and click Next.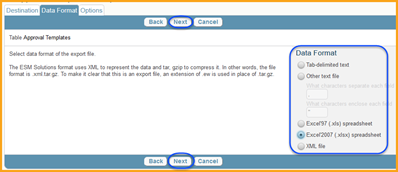
The options tab will provide each user a list of options for exporting the information, including which fields are being exported. The Export section will determine which records are part of the export process. This can be updated based on a saved search, all records, or the records already selected. The Export Labels section will allow the exported file to carry the column labels and is generally advisable to leave this as Yes. The Include Attached Files section will allow attachments to be export with the records they are associated with, in its own folder. The Output of Date/Time fields will default to the system time, regardless of where the user is located, but can be updated to a different time zone, thus different information if necessary. Finally, the Fields section allows each user to specify which fields are exported. Select the fields needed to export, or select all, and click the Finish button. The resulting file will be available to be saved to their computer or network drive.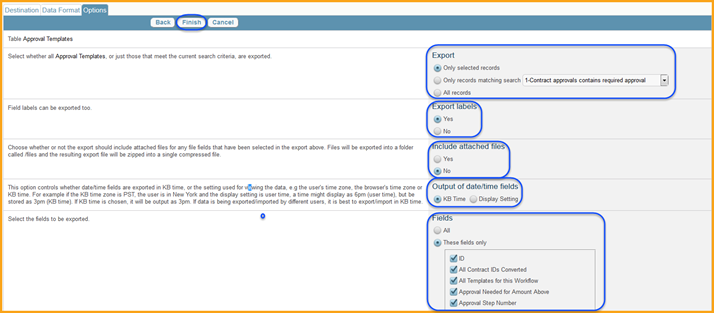
Import
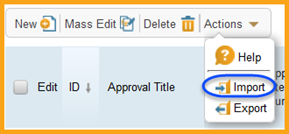
Within the required table, use the drop down next to Actions within the Action Bar to select the Import option.
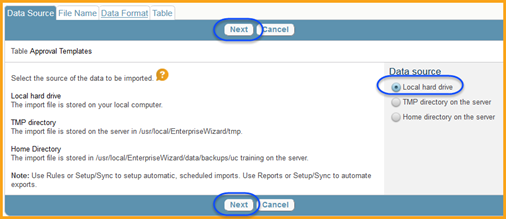
The Import Wizard will ask where the data source is located. Always select Local Hard Drive to import a file from a user’s computer or a network drive, and then click next.
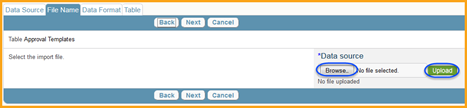
In the File Name section, use the Browse button to find the file used for the import and Upload button once a file has been selected.
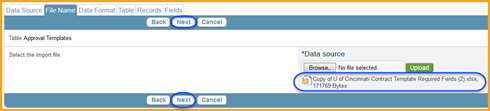
Once a file has been selected and uploaded, the file name will appear in the Data Source, and then click the Next button.
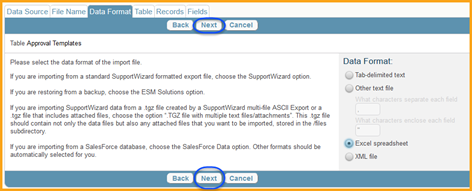
The Data Format section will automatically detect the file format, but can be updated as needed here. Click next once the data format has been selected.
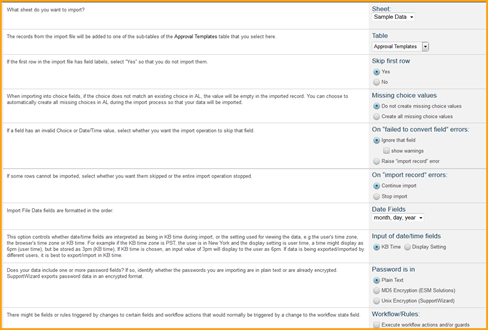
The Table section will provide a list of important options to choose from. The Sheet section will allow each user to select the correct excel sheet the import is using. The Table section will default to the table that was previous selected, in which the import will occur. The Skip Fist Row section will allow the user to prevent the first row from being imported, if it is used as a column header. The Missing Choice Values section will allow the user to determine if any choice values that do not currently exist in the system will be created. In most cases choose Do Not Create Missing Choice Values or the existing choice lists will be altered with significantly more options. The On “Failed to Convert Fields” Errors section will allow the user to determine if the data import will show the error during the import or ignore them. It is generally advisable to select Ignore that Field, but choose the Show Warning box. The On “Import Record” Errors section will allow the user to determine if an error will stop the import completely, or only prevent the error record from being imported. The Date Fields section must be updated to match how date records are entered on the source file, if any exist. The Password in section must be updated to reflected how passwords are entered in the source file, if any exist. Finally, the Workflow/Rules section can be chosen to have the system automatically run all rules that currently govern the table after the import has been completed. This is important for notifications if the table will contain any. Once all options are determined, click Next.
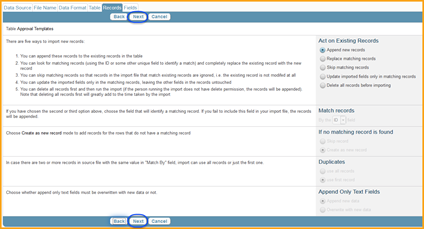
The Records section will allow the user to determine how the data is imported. The Act On Existing Records section will allow users to add the new values to the system, update matching values, or delete records. When adding new records to a table, choose Append New Records.
If the Replace Matching Records option is selected the Match Records section will allow the user to determine how the records in the system and the records in the source file are matched. The If No Matching Record Is Found will allow the user to create new records when a match is not found between the system and the source file. The Duplications section will allow the user to determine which duplicate records are used for the import. Finally, the Append Only Text Fields will allow the user to enter information in append only text fields or overwrite the existing information from the upload. Once the options are chosen, click Next.
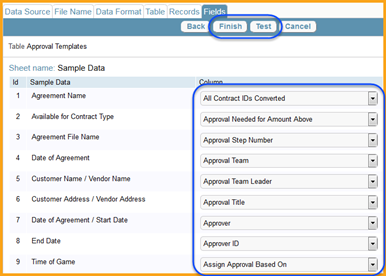
Finally, the Fields section will allow the user to determine which columns in the source file correspond to which fields in the system. The system will attempt to match the columns and fields based on the column name, but may not always be accurate. It is generally advisable to have the source file column headers match the system field names for quicker automation. Use the drop down to select which field the source file column corresponds to. Select *Not Imported* if the source file column will not be imported. Once all fields are selected, click Test to test the upload. The test will display any errors that are found, allowing users to make the necessary adjustments in the setup. Once all changes are finalized, click Finish to upload the new records.
Reports
Reports can be built to export information and data from the system, in a specified format, using a pre-built view and search. This will allow the user to determine which records are being reported on (from a saved search) and which fields are being shown (from a saved view). Additionally, charts and graphs can be included with the report output.
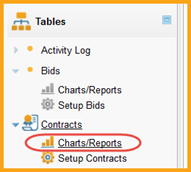
Navigate to the table in which the user would like to report on and use the drop down to select Charts/Reports.
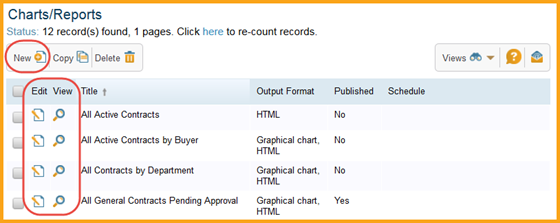
A list of any existing charts/reports will be available to be edited or viewed. Click New to create a new chart/report.
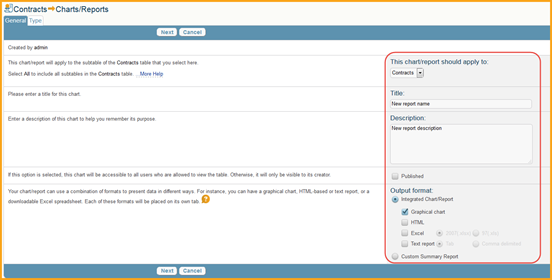
In the General tab, select the table the chart/report will be applied to. Each user can only select the original table or any of its sub-tables. Give the chart/report a title and a description to help identify its purpose. If the user’s permission access allows it, they can choose to publish the chart/report. This will allow other users to see and run the chart/report when they navigate to the Charts/Reports section of the table. Finally, choose the output format. We generally recommend leaving the Integrated Chart/Report choice selected, which will allow the user to build the chart/report from the information found in the system. Selecting Graphical chart will include a graphical chart in the output, which will need to be defined. This is helpful when displaying information, but not helpful when obtaining system data. Selecting HTML will export the data in an HTML format. If a user is unfamiliar with this format type, do not choose this. Selecting Excel will export the data in an .xlxs or .xls format and is the most common output method chosen. Finally, selecting Text report will export the data in a tab or comma delimited format. Once the user has made their selections click Next to move to the Type tab. For this example we will be exporting the data in an Excel format.
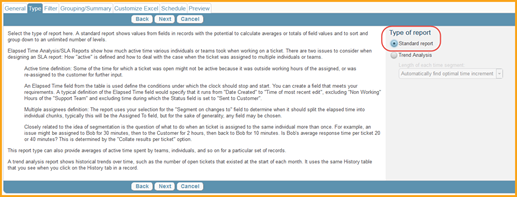
The Type tab will allow the user to determine the type or report as either Standard or Trend Analysis. Standard report is the most common format and is generally the required type. Once they have chosen their type click next to move to the Filter tab.
The Filter tab will allow the user to determine which records the report includes. The Relative dates section will allow each user to specify which records are included, based on a time relative time frame. By default the Start Date of “Date of Earliest Record” is selected and is the advisable choice. This will include all records since the first record was created in the table. While each user can select a relative date to meet their requirements, it is generally advisable to leave this field as is. By default the End Date is set to “Today”, which means all records created up until this day will be included. While each user can specify an end date, it is generally advisable to leave this field as is. User’s can also specify Absolute Dates as opposed to Relative Dates. This will allow them to specify an exact start and end time for the report. The Based on selection will default to the Date Created field, which should not be changed if the defaults Relative Dates are chosen. The report shows records will be preset to All Records; however, if they are specifying a different report type they can specify this field to match their requirements.
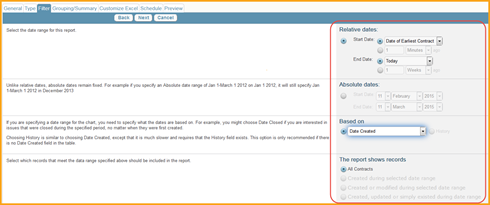
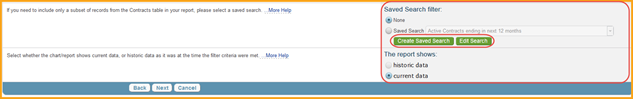
The Saved Search Filter selection is used to determine which records are included in the chart/report. By default, selecting None will include all records that exist in the table. However, if the report should only be showing particular records, such as “Active contracts created by me” a saved search can be created with the Create Saved Search action button, or an existing saved search selected. To create a saved search see the Saved Search section below. Once a user has determined which records will be part of the chart/report, select whether or not the report will show current data or historical data. It is generally advisable to only show current data. Click next when ready to move to the Grouping/Summary tab.
The Grouping/Summary tab will allow each user to create custom grouping and summary displays for their report. The Summary information section will show all summaries build and allow the user to create a new summary. All summary information is included in its own section of the chart/report (for example a tab in an excel file contains all summary information and another contains all raw data). Click New to create a new summary.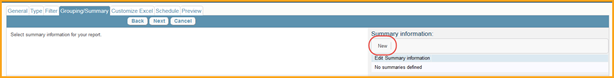
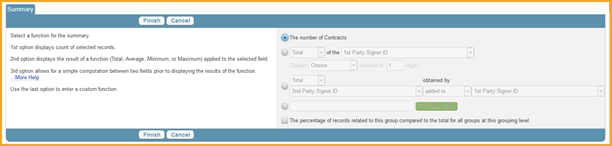
A new Summary will allow each user to automatically summarize the data based on the criteria entered. By default the system will summarize the number of records found. Users’s can also choose the 2nd option which will automatically perform function calculations based on the field of their choice. Choosing the 3rd option will perform computations based on up to 2 different fields. Choosing the 4th option will allow the user to enter a customized formula, using the Formula Help guidelines. Finally, each user can opt to show the percentage of records related to this group compared to all groups with the final check box. Once a summary is created it will now show in the Summary Information section.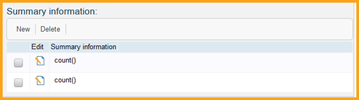
After to have selected the necessary summary information, if any, the Show Records? section will allow the user to determine what data, if any, is part of the chart/report. Since most reports are used to obtain raw data from the system, it is important to choose “Show records using view selected below”. This will allow each user to pick which fields, in which order, are part of the data output. Use the drop down to pick the view the user has already built, or click the New action button to create a new view. Additionally, it is generally advisable to use the drop down to select the maximum amount of record per grouping, to ensure that all records are included.

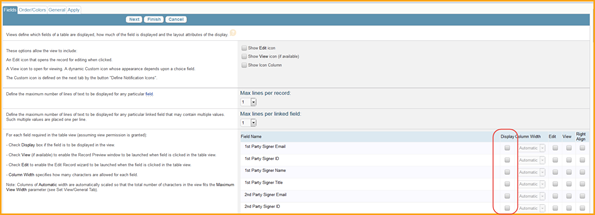
The New action button will open a new window to create a new view. Note: this may take several seconds to load, depending on the size of the table in question. The Fields tab will list all fields found in the table. Users can disregard the top section when creating a view specifically for a chart/report, as they are used to determine if the Edit/View/Icon is visible when using the view in the system. Additionally, each user can disregard the Max Lines per record and Max lines per linked field when creating a view specifically for a report. Locate all fields the user wants to include in the report and chick the box under Display to include them. If the view is for a report, users can disregard the Edit/View/Right Align options. The default column width of Automatic will attempt to automatically determine the size requirements and will work for most fields, except long text fields. Fields that are long text and contain a significant amount of text should have their width changed to the highest value available. Once a user has selected all of the fields they would like to be part of the view, click Next to move to the Order/Colors tab.
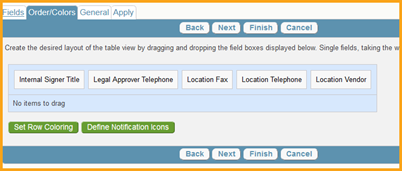
The Order/Colors tab will allow users to determine the order in which the fields display in the outputted data. Simply drag and drop a field to the left or right of another field to determine the order. Users can ignore the Set Row Coloring and Define Notification Icons if the view is specific to a chart/report. Once they have determined the order, click Next to move to the General tab.
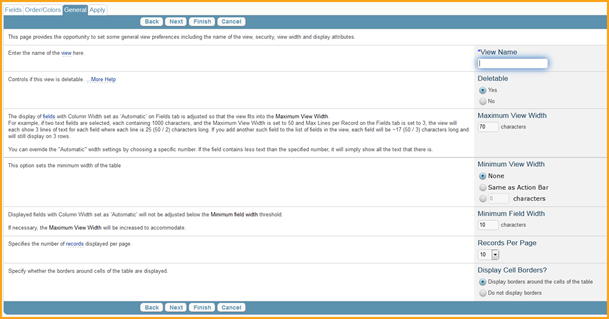
For views created for charts/reports the general tab only has 2 important pieces of information. First give the view a name, so that it can be referenced and selected later. Next, set the Maximum View Width to a value that will encompass the largest field’s value. For example, users may want to set the Maximum View Width to a large number, such as 1000, if they will have fields that will contain up to 1000 characters. All other options can be ignored. Once complete, click Next to move to the Apply tab.
The Apply tab will allow users to share the view with other users, if their permissions allow them to share views. If they wish to share the view, select the groups to share with. However, it is generally never advisable to “Make this a default view for”. Once complete, click Finish to save the view. With the new view created, selected it in the “View for showing record” drop down. Finally, they can group data by creating new groups with the New option under “Group data by:”
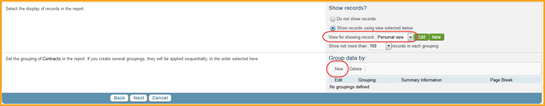
Grouping data will display the information grouped together based on the specified grouping. Users can select the field they want the grouping to occur based on, or they can choose any fields that are found from other linked tables. Finally, they can create custom summary information (similar to the summary info described above) and include page breaks for each groupings. Click Next once they have determined the grouping requirements to move to the Sorting tab.
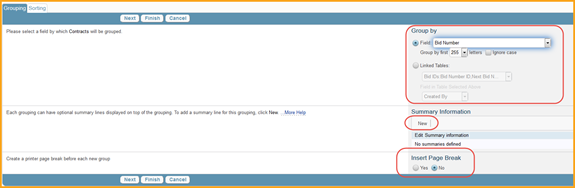
The Sorting tab will sort the groups based on the values within them, or determined by the options available. Finally, users can choose to show the results in Ascending or Descending order. Click Finish when completed and the grouping will be shown in their Group data by section.

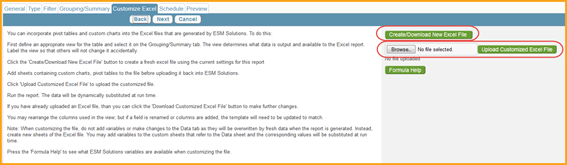
Click Next to move to the Customized Excel tab. This tab will allow users to download and create a customized excel that will be used for the chart/report output. Note: this is only available with charts/reports using an Excel based output. Click the Create/Download New Excel File action button to download a template to create a customized excel. These templates can be used to create Pivot Charts and other features in an excel document that will always be displayed on the report output. Each time the report runs, it will simply update the data, and the corresponding customization will reflect this. It is useful to automate the manipulation of data, but not necessary if users are only attempting to obtain raw data. Once they have their customized excel file, click the Browse button to find the document and the Upload Customized Excel File action button to load it. Once done, click Next to move to the Schedule tab.
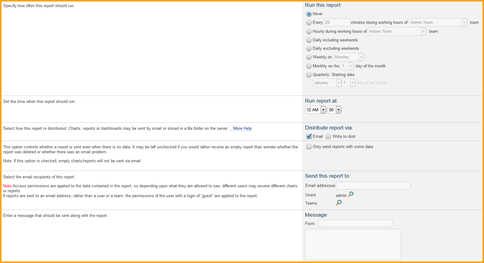
The Schedule tab will allow users to automate the running of the chart/report. Under the Run this report: section users can choose what minute, day, week, monthly, or quarter the report runs. After this, users can specify what time the report runs in the Run report at: section. If they are choosing to automate the report, it is usually best to distribute via email. While users can write to disk, they will not be able to access where it is written to, so this option should be avoided. Checking the box for “Only send reports with some data” is generally advisable, as it will only email reports that actually contain information. After this, enter the email information of where the users would like to send this to, or the specific users or teams. Finally, users can create a custom message the email will include when being sent, to help notify users what the chart/report is for. Once completed, click Next to move to the Preview tab.
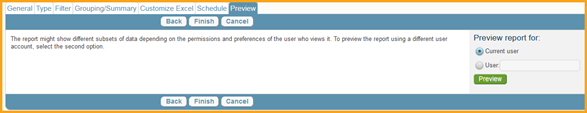
The Preview tab will allow users to preview the chart/report before saving. By default it will preview the report for the current user, but a different user can be specified in order to ensure the information being presented matches their access rights. Click the Preview button to run the report for review. Once completed, click Finish to complete the chart/report.
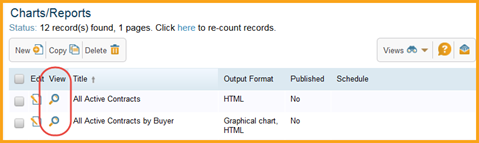
Now that a chart/report exists, click the View icon on the Charts/Reports page to manually run the report, or wait until the report is sent based on the schedule entered.
Comments
Please sign in to leave a comment.